Chiropractor Salary in Richmond, VA: $83,632 (2026)
Quick Answer:A full-time chiropractor in Richmond, VA earns a median $83,632/year (≈ $40.21/hour) in nominal terms for 2026 — projected from BLS OEWS 2025 (SOC 29-1011). Once you factor in Richmond's price level (2% below national, BEA RPP 97.9), that paycheck buys what $85,463 would nationally. Nominal pay sits 0.0% above the Virginia state average.
Official BLS data · View source
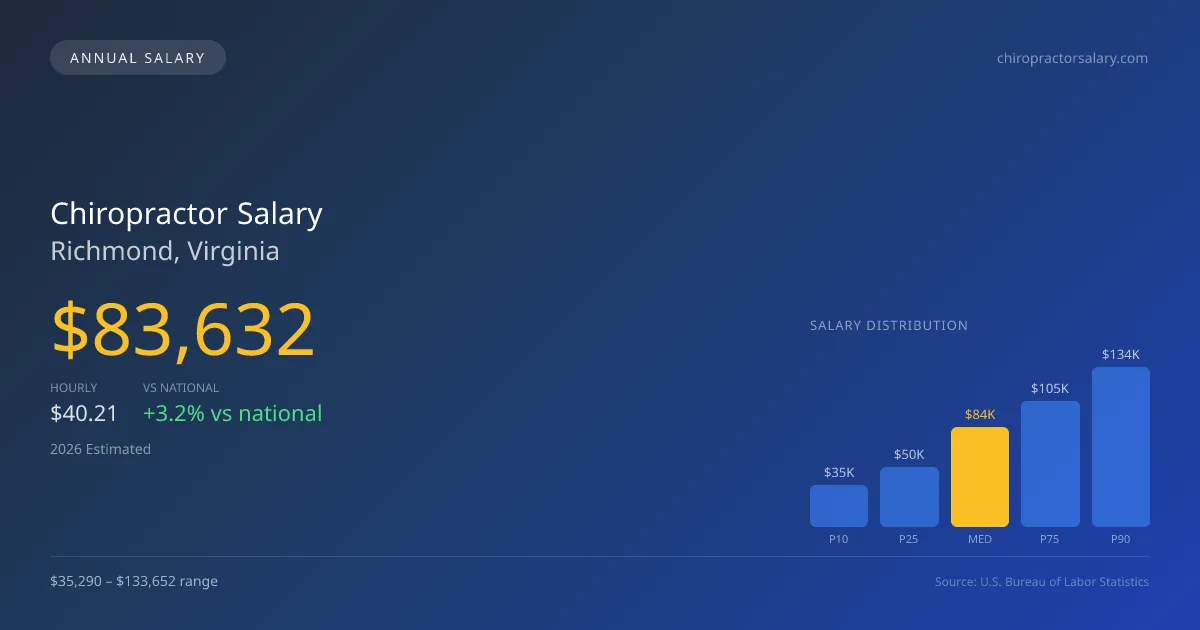
Chiropractors in Richmond, Virginia, earn a median annual salary of $83,632 in 2026, reflecting a competitive position relative to the national median of $81,014. The salary spectrum for this profession in the area extends from $35,290 at the lower end to $133,652 at the top, showing a significant range that is influenced by factors such as practice ownership models and the shift toward subscription payment structures. This data is derived from official BLS OEWS surveys and captures the evolving dynamics of chiropractor compensation. In Richmond, the job market for chiropractors is bolstered by a growing shift in patient payment preferences, as both cash-pay and insurance models adapt to changing healthcare landscapes.
Salary Breakdown
| Percentile | Annual | Hourly |
|---|---|---|
| Entry Level (P10) | $35,290 | $16.97 |
| Lower Range (P25) | $50,143 | $24.11 |
| Median (P50)(typical) | $83,632 | $40.21 |
| Upper Range (P75) | $105,195 | $50.57 |
| Top Earners (P90) | $133,652 | $64.26 |
Median Salary Position
3.23% above the national average
2026 Salary Percentile Distribution in Richmond
In Richmond, VA, the chiropractor salary spread from the 10th to 90th percentile is $98,362 (2026 est.). At $83,632, the local median is 3.23% above the national median of $81,014.
Salary Calculator
At 40 hours/week in Richmond: You'd be in the lower-middle range
How Richmond Chiropractor Pay Compares
Richmond median: $83,632/year (2026)
| Compared To | Median Salary | Richmond Pays |
|---|---|---|
| National Average | $81,014 | +3.23% more |
Chiropractors in Richmond, VA earn a median of $83,632 per year (2026 est.), which is 3.23% higher than the national median of $81,014.
Cost-of-Living Adjusted Salary
Richmond has a cost of living 2.14% below the national average, meaning your salary goes further here.
Adjusted salary = nominal × (100 / CoL index). CoL index: 100 = national average.
Richmond, VA has a cost-of-living index of 97.858 (below the national average of 100). A chiropractor earning $83,632 nominally has purchasing power equivalent to $85,463 in an average-cost city — an effective 2.19% boost.
Compare Purchasing Power
Select a city to see how your salary compares after cost of living
Select a city above to compare purchasing power
2019 BLS Actual
$69,500
2025 BLS Actual
$81,760
2026 Current Est.
$83,632
2019–2027 Growth
+23.1%
Salary Trajectory for Chiropractors in Richmond (2019–2027)
2019–2025: actual BLS OEWS data for this metro area. 2026+: CAGR 2.29% projection.
| Year | Annual Salary | Status |
|---|---|---|
| 2019 | $69,500 | Actual |
| 2020 | $68,550 | Actual |
| 2021 | $62,470 | Actual |
| 2022 | $53,940 | Actual |
| 2023 | $63,010 | Actual |
| 2024 | $91,040 | Actual |
| 2025 | $81,760 | Actual |
| 2026(current) | $83,632 | Estimated |
| 2027 | $85,547 | Projected |
Based on 7 years of BLS OEWS data for the Richmond metropolitan area, the median chiropractor salary grew 17.6% from $69,500 (2019) to $81,760 (2025). At a 2.29% compound annual growth rate, salaries are projected to reach $85,547 by 2027 — a total increase of $16,047 (23.09%) from 2019.
Note: Historical values (2019–2025) are actual BLS OEWS figures for the Richmond metropolitan area, sourced from annual Occupational Employment and Wage Statistics surveys. 2026–2026 figures are current estimates, and 2027 values are projections, calculated using a 2.29% CAGR derived from 7-year BLS historical data. Actual salaries may vary based on employer, experience, certifications, and local market conditions.
Salary by Experience Level
| Experience | Estimated Salary Range |
|---|---|
| 0-2 years (New Graduate) | $35,290 – $50,143 |
| 3-5 years (Mid Career) | $50,143 – $83,632 |
| 5+ years (Experienced) | $83,632 – $105,195 |
| 10+ years (Top Earner) | $105,195 – $133,652 |
DC salary ranges estimated from BLS percentile data. Individual chiropractor compensation varies by employer, certifications, and specialization.
Chiropractor Job Market in Richmond
The local job market has room for growth with around 70 chiropractors currently practicing in the Richmond area. A cost of living index of 97.858 suggests that while salaries may not be the highest in the region, the relative affordability helps stretch take-home pay further. Employment opportunities vary, with solo private practices being the most common, but multi-doctor clinics and integrated medical facilities often offer higher compensation. The disparity in earnings is largely driven by practice equity, the ability to adopt subscription or membership models, and the roles that cash-pay versus insurance income play. For those looking to maximize their income in Richmond, strategies may include considering collaboration with sports medicine clinics or integrated practices that can enhance referral opportunities while exploring how to leverage subscription pricing as a viable income solution.
More salary data for Richmond, VA:
Frequently Asked Questions
How much do chiropractors make in Richmond, VA in 2026?
Is Richmond, VA a good place to work as a chiropractor?
Can chiropractors make $100K in Richmond?
What is the cost-of-living adjusted chiropractor salary in Richmond?
How much does a chiropractor make per hour in Richmond?
Related Pages
Compare Salaries
Career Resources
Nearby Cities in Virginia
Written by Maria Gonzalez, D.C.
Career Analyst
Maria has 10 years of experience as a chiropractor. She specializes in sports injuries and practices in a private clinic. Maria also conducts workshops for community health education.
Methodology & Data Source
Salary figures on this page are 2026 projections based on the Bureau of Labor Statistics Occupational Employment and Wage Statistics (OEWS) survey, May 2026 release. The BLS reported a median annual salary of $81,760 for chiropractorsin the Richmond metropolitan area. A 2.29% compound annual growth rate (CAGR), calculated from 6-year national BLS wage trends, was applied to project current 2026 compensation. Percentile ranges (P10–P90) represent the full salary distribution across experience levels and practice settings in this market.
Data Sources & Methodology
Source: BLS, OEWS, 7-year dataset (–). Per-city data from annual BLS metropolitan area surveys.
2026 figures are projected from 2025 BLS data using a compound annual growth rate (CAGR) of 2.29%, derived from historical BLS wage trends for chiropractors (SOC 29-1011).
Compiled and verified by Maria Gonzalez, D.C., a licensed chiropractor with 10+ years of clinical experience. · View source data at BLS.gov